European Testate Amoeba dataset: an interactive visualisation
 |
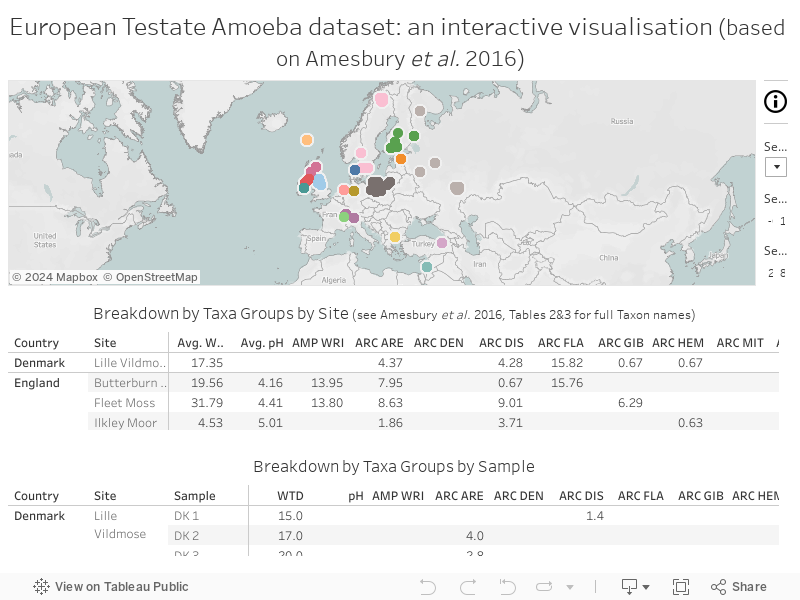
| Screenshot of the Tableau Dashboard. Available [here] and at the end of this post. |
I’ve recently been working with Dr Graeme Swindles
(University of Leeds) and Dr Matt Amesbury (University of Exeter) on producing an
interactive visualisation based on their European Testate Amoeba dataset.
Testate amoebae are microscopic, unicellular shelled protozoa that are
abundant in a range of wetlands, including peatlands. Study of fossil testate
amoebae allows for the reconstruction of ancient hydrological variability.
Amesbury and Swindles were the lead authors of a group that published Development
of a new pan-European testate amoeba transfer function for reconstructing
peatland palaeohydrology in Quaternary Science Reviews (Volume 152,
15 November 2016) [https://goo.gl/15n4QW].
They placed their dataset in the public domain under a Creative Commons
licence, allowing others access to reanalyse and re-examine their data, and
incorporate it into future research. The dataset is presented as an Excel sheet
and, the authors themselves admit, is difficult to comprehend. I’ve been
working with them over the last few months to create a visualisation in Tableau
Public that dynamically presents Taxa data at geographical, site, and sample
levels. The resulting dashboard looks simple, but a significant amount of time
& effort went in to paring it back to its essentials, while presenting the
data in an appropriate and meaningful way.
If there are issues with this embedded version, try the dashboard on my Tableau Public page [here]
If there are issues with this embedded version, try the dashboard on my Tableau Public page [here]


Comments
Post a Comment